What top hedge funds bought, and what it means for your shares
Recent insights and trends into stocks purchased by top US hedge funds
 Know more
Chip stocks had their best quarter on record
Funds bought into the strongest three months the chip sector has ever had.
+87.8%The Philadelphia Semiconductor Index. Its best quarter since the index began in 1994.
- +14.9%S&P 500The whole market
- +87.8%Chip index (SOX)Its best quarter since 1994
- +216%IntelAMD rose 186%
Price move, 31 March to 30 June 2026
Ten new companies joined the market
Funds subscribed and purchased strongly into the new IPOs.  users can now apply for IPOs directly from the app.
1,757funds owned SpaceX nineteen days after it floated. It was also the single largest purchase any fund made last quarter.
- 01Honeywell AerospaceSeparated from Honeywell
 2,075
- 02SpaceXFloated at $135 a share
 1,757
- 03FedEx FreightSeparated from FedEx
 1,138
- 04Cerebras SystemsAI chip designer
 416
- 05X-EnergySmall modular nuclear reactors
 190
- 06Fervo EnergyGeothermal power
 183
- 07QuantinuumQuantum computing
 175
- 08First Tracks BiotherapeuticsBiotechnology150
- 09AEVEXAerospace and defence
 147
- 10DPC HoldingsIndustrials144
The two largest floatsSeparated from a parentSmaller arrivals
Funds holding the shares at 30 June 2026
Even within chips, returns varied widely
- +216%
 Intel
- +186%
 AMD
- +88%Chip index (SOX)
- +22%
 Broadcom
- +15%
 NVIDIA
- +15%S&P 500
Closing prices from 31 March to 30 June 2026. Applied Materials, KLA and Lam Research each more than doubled in the same period.
Most number of funds owned Intel, Micron and AMD
These are the total funds owning these stocks
- 1,018Intel
- 857AMD
- 693
 Marvell
- 922
 Micron
- 654
 SanDisk
- 594
 Applied Materials
- 522
 Lam Research
- 512
 Seagate
- 511
 Dell
- 472
 Palo Alto Networks
Net new fund owners, grouped by business. Categories are ours, not a verified supplier network.
Top stocks owned by funds across different market caps

The top three in each size band, net new fund owners, one scale
- 1,019
- 923
- 858
- Intel
- Micron
- AMD
Mega capOver $200bn
- 451
- 445
- 346
 Corning
 Western Digital
 Nebius
Large cap$10bn to $200bn
- 405
- 199
- 168
 Versigent
 MaxLinear
- Infleqtion
Mid cap$2bn to $10bn
- 116
- 88
- 87
 Wolfspeed
 Ambiq Micro
 SharonAI
Small cap$250m to $2bn
- 69
- 57
- 52
 HMH Holding
 Soluna
 Sidus Space
Micro capUnder $250m
Smaller companies cover more than one business
Chips appear alongside quantum computing, gold and AI services.
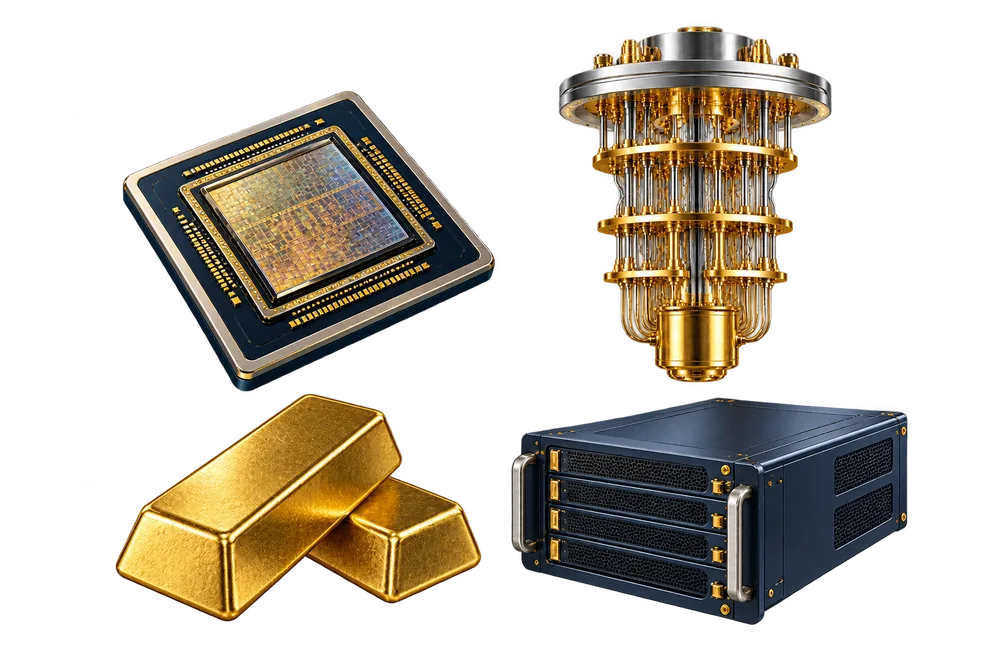
405net new fund owners for Versigent, a $3.2bn company
| Band | Company | Size | New owners |
|---|---|---|---|
| Mid cap | Versigent | $3.2bn | 405 |
| Mid cap | MaxLinear | $8.2bn | 199 |
| Mid cap | Infleqtion | $3.1bn | 168 |
| Mid cap |  Vishay Intertechnology | $5.0bn | 168 |
| Mid cap |  OceanaGold | $6.3bn | 153 |
| Mid cap |  Penguin Solutions | $2.8bn | 129 |
| Small cap | Wolfspeed | $1.5bn | 116 |
| Small cap | Ambiq Micro | $1.6bn | 88 |
| Small cap | SharonAI Holdings | $1.9bn | 87 |
Chip companies
Net new fund owners by market capitalisation. ETFs and companies that listed during the quarter are excluded.
Funds also reduced familiar technology holdings
These companies had more funds cutting their holdings than adding.
- 1,835Honeywell
- −513
 Cisco
- −470
 Salesforce
- −413
 Qualcomm
- −363
 Apple
- −352
 Danaher
- −340
 Walt Disney
- −332
 Abbott
- −321
 Alphabet
- −299
 Lowe’s
Net sellers are funds that cut a position, less funds that added to it. Honeywell’s one-for-two reverse split registers as a position change on thousands of books.
Where hedge funds increased or decreased positions

4 of 8of the largest conviction purchases were S&P 500 trackers, not companies
Increased holdings
| Fund | ChangeValue |
|---|---|
 Jane StreetS&P 500 tracker, SPY | +118%$17.4bn |
| CalPERSS&P 500 tracker, IVV | +1,098%$10.1bn |
 CitadelS&P 500 tracker, IVV | +335%$9.91bn |
 D. E. ShawS&P 500 tracker, SPY | +1,782%$9.63bn |
 Berkshire HathawayAlphabet | +658%$8.44bn |
 SG AmericasMicrosoft | +339%$7.43bn |
 T. Rowe PriceMicron | +165%$6.62bn |
 InvescoSanDisk | +381%$6.35bn |
Reduced holdings
| Fund | ChangeValue |
|---|---|
 FidelityMarvell | −57%$14.9bn |
 Sanders CapitalSeagate | −73%$7.18bn |
 BlackRockHoneywell | −53%$5.81bn |
| LM AdvisorsBerkshire Hathaway | Sold out$5.17bn |
| FidelityCoherent | −51%$4.12bn |
 ArrowstreetBroadcom | −54%$4.07bn |
 Bank of Nova ScotiaBooking Holdings | −97%$3.60bn |
| FidelityLumentum | −51%$3.27bn |
S&P 500 trackers
Percentages are stake changes over the quarter; dollar figures are quarter-end position values, not amounts spent.
Funds disagreed about 
Berkshire bought. Pershing Square sold out. Tiger Global reduced its holding.
$17.27bnBerkshire Hathaway’s Alphabet purchase. 91% of everything it bought in the quarter.
Berkshire’s four largest purchases
- Alphabet
 $17.27bn
- Delta Air Lines
 $1.32bn
- Lennar
 $269m
- Macy’s
 $90m
Other funds’ Alphabet holdings
| Fund | In the quarter |
|---|---|
 Renaissance | Bought $639m |
| Duquesne | Bought $121m |
 Pershing Square | Sold out |
 Tiger Global | Cut 45% |
Alphabet’s two share classes are combined. 2,342 funds cut Alphabet in the quarter while 2,021 added.
Stocks where longtime holders trimmed positions
Years of ownership did not stop these funds from reducing some holdings.
12.2 yearsthe average time Bonness Enterprises has held each of its positions
Average time each position has been held
- Bonness Enterprises39 holdings12.2 years
- Blackhill Capital49 holdings11.2 years
- Greenbrier Partners11 holdings10.4 years
- Pacific Heights78 holdings9.8 years
- Cacti Asset Management78 holdings9.6 years
What they did with the quarter’s favourites
| Company | In Q2 | Fund, held for |
|---|---|---|
| Intel | Cut 15% | Bonness, 13 years |
| Applied Materials | Cut 12% | Bonness, 13 years |
| Seagate | Cut 17% | Cacti, 9 years |
| Corning | Cut 21% | Bonness, 12 years |
Funds holding at least ten companies, sorted by average time held. These five describe only themselves.
Start with the shares you already own
Rovia helps you see your vested shares and estimate the tax before you sell.
 Get the Rovia app
All figures are from Wall St. Rank’s Q2 2026 Fund Flows Report, built on fund disclosures for 1 April to 30 June 2026, made public 14 August 2026. The next set is due 16 November 2026. This page is information, not advice, and past patterns are not a guide to future returns.